
Are static visuals leaving your audience disengaged? Interactive infographics might be the key to transforming mere spectators into active participants. By enabling dynamic user interaction, these innovative infographics deepen engagement and enhance information retention. This article explores the essence of interactive infographics, illustrating their capability to connect more profoundly with audiences, offer immersive content experiences, and boost overall engagement metrics. Dive into the details as we define, design, and demonstrate the benefits, supported by compelling case studies and predictions of future trends. Discover how these vibrant tools can revolutionise your audience connection strategy.
Understanding Interactive Infographics Engagement
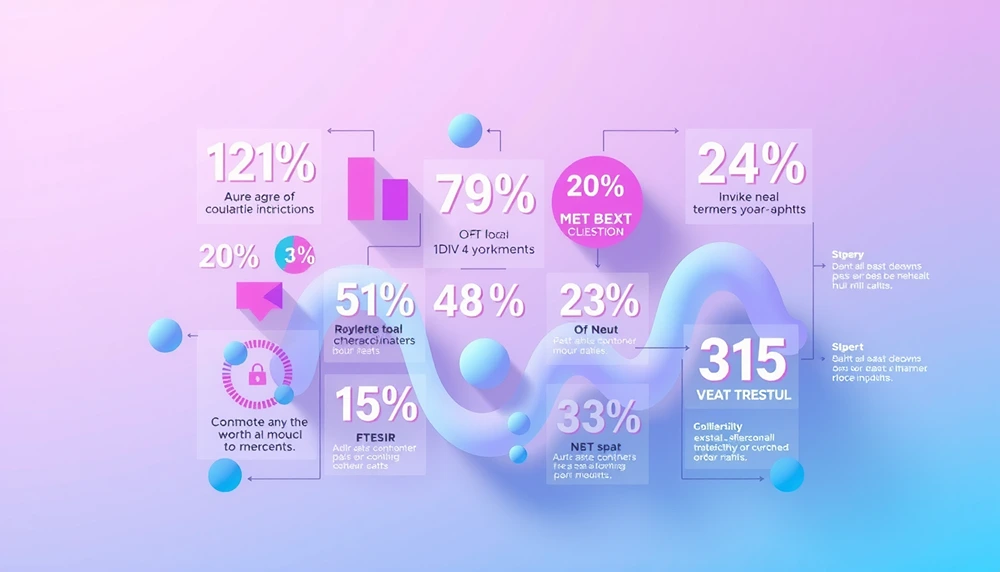
Interactive infographics serve as a dynamic tool in digital marketing, transforming passive consumers into active participants. By engaging users through interactive elements, these infographics significantly boost audience engagement. This transformation is achieved by allowing users to manipulate and explore data, creating a more immersive experience than traditional static visuals.
How do interactive infographics enhance user interaction? The answer lies in their design, which incorporates clickable elements, animations, and data visualisations. These features invite users to engage with the content actively, rather than merely observing it. The user is encouraged to explore different layers of information, making the experience both informative and enjoyable. This interaction leads to a deeper connection with the material, as users are more likely to remember content they have actively engaged with.
Interactive infographics also play a crucial role in improving information retention and comprehension. By engaging multiple senses, they facilitate better understanding and memory recall of the information presented. Users who interact with data are more likely to retain and comprehend complex information, as the interactive process helps to break down intricate details into manageable parts. As a result, these infographics not only enhance engagement but also ensure that the audience leaves with a thorough grasp of the content.
Designing Effective Interactive Infographics
Interactive infographics require the integration of key design elements to enhance user engagement and information delivery. Crucial design techniques include interactivity, which transforms data into dynamic content, and user-centric design, ensuring that infographics are intuitive and accessible. Innovative visuals capture attention and convey complex information succinctly. By combining these elements, interactive infographics can effectively engage audiences and elevate the presentation of data.
Key Design Elements
Graphic design and user-centric approaches are pivotal in crafting interactive infographics. Graphic design ensures that visuals are both appealing and functional, using colour schemes, typography, and layout to guide the user’s journey through the content. User-centric design focuses on the needs and behaviours of the audience, tailoring the interactivity for maximum engagement. This approach employs user testing and feedback to refine the interface, ensuring an optimal user experience that encourages exploration and interaction.
Tools and Technologies
Creating interactive infographics involves leveraging advanced tools and technologies:
- Adobe Illustrator: This tool is widely used for creating detailed vector graphics, providing designers with robust features for developing intricate infographic components.
- Tableau: Known for its data visualisation capabilities, Tableau helps in transforming complex datasets into interactive charts and graphs, enhancing the storytelling aspect of infographics.
- Canva: Offering user-friendly design templates, Canva enables quick creation of interactive visuals, suitable for both novice and professional designers.
- Infogram: A platform designed for building interactive and responsive infographics, Infogram facilitates easy integration of data sources for dynamic content updates.
- Google Charts: This tool provides a simple way to embed interactive charts into websites, supporting a variety of chart types and customisation options.
Continuous innovation in design is essential to keep interactive infographics engaging and relevant. As audience expectations evolve, designers must adapt by incorporating emerging technologies and design trends. This ongoing development ensures that infographics remain a powerful tool for engaging audiences and conveying information effectively.
Benefits of Interactive Infographics for Audience Engagement
Interactive infographics significantly enhance user interaction and data visualisation by transforming passive data consumption into an engaging experience. These infographics utilise dynamic elements like clickable components and animations to invite users to actively participate in exploring the data. This interactivity not only captures attention but also fosters a deeper understanding of the content. By engaging users in an interactive environment, infographics make complex data more accessible and memorable. Such active participation results in improved information retention, as users are more likely to remember content they have explored interactively.
- Increased audience retention through engaging content
- Enhanced engagement metrics by fostering active participation
- Improved data comprehension via intuitive visualisation techniques
- Greater user satisfaction as a result of interactive elements
In comparison to static infographics, interactive versions offer a more immersive experience. While static infographics present data in a fixed format, interactive infographics allow users to control their journey through the data, exploring at their own pace and interest. This flexibility leads to higher engagement levels, as users can delve deeper into areas that capture their interest, ultimately resulting in a more personalised and impactful interaction.
Case Studies: Successful Use of Interactive Infographics

Case studies provide tangible evidence of how interactive infographics can transform audience engagement. By examining specific industries and their objectives, these real-world examples highlight the benefits and outcomes achieved through innovative infographic designs.
Case Study 1: Industry and Outcomes
In the education sector, a university implemented interactive infographics to enhance student participation in online learning modules. The primary objective was to improve engagement by providing an interactive learning environment. The infographic incorporated clickable elements and animations, allowing students to explore complex topics at their own pace. This approach resulted in a 30% increase in course completion rates and significantly higher student satisfaction scores. Through this case study, it is evident that interactive infographics can create a more engaging and effective educational experience, enhancing both comprehension and retention.
Case Study 2: Industry and Outcomes
In the retail industry, a fashion brand utilised interactive infographics to boost customer engagement during their online campaigns. The objective was to increase audience interaction with their new product lines. By integrating dynamic visuals and interactive features, such as 360-degree product views and customisable outfit combinations, the brand achieved a 50% rise in click-through rates and a 20% increase in sales. This case study illustrates the power of interactive infographics in enhancing customer interaction, driving both engagement and conversions.
These case studies highlight the effectiveness of interactive infographics across different sectors, demonstrating how they can significantly improve audience participation and engagement. By tailoring infographics to the specific needs and objectives of an industry, businesses can leverage these tools to achieve remarkable outcomes, fostering deeper connections with their audiences.
Future Trends in Interactive Infographics Engagement
Current trends in interactive infographics are steering towards more sophisticated user engagement and data visualisation techniques. The integration of advanced technologies is enabling infographics to become more dynamic and personalised, catering to the increasing demand for engaging and immersive content. This shift is also driven by the need for infographics to stand out in a crowded digital landscape, pushing the boundaries of traditional design methods.
Innovations in Interactivity
Innovations in interactivity are central to the evolution of infographics. The incorporation of virtual reality (VR) and augmented reality (AR) technologies allows users to experience data in a three-dimensional space, providing a more immersive interaction. These technologies enable users to interact with content in ways previously unimaginable, such as exploring complex datasets from different angles or visualising theoretical models in a tangible form. Additionally, the use of artificial intelligence (AI) in creating predictive infographics is becoming more prevalent, allowing for real-time data analysis and visualisation that adapts to user inputs, enhancing the overall user experience.
Future Predictions
- Personalised Content: Infographics will increasingly tailor content based on user preferences and behaviour, offering a more customised experience.
- Voice Interaction: Integration with voice-activated devices will allow users to navigate and query infographics using natural language processing.
- Data-Driven Storytelling: Enhanced narrative techniques will be employed to guide users through data stories, making complex information more relatable.
- Collaboration Features: Collaborative tools will enable multiple users to interact with the same infographic in real-time, fostering collective data exploration.
- Gamification Elements: Incorporating game-like features will encourage deeper engagement, rewarding users for exploring different aspects of the infographic.
Smarter Digital Marketing plays a pivotal role in leveraging these trends, using advanced analytics and user insights to create interactive infographics that not only captivate but also convert. By embracing these innovations, businesses can enhance audience connection and drive meaningful interactions.
Final Words
Interactive infographics significantly boost audience engagement by transforming passive viewing into active participation. Their design relies on user-centric methods and advanced tools, ensuring dynamic content presentation.
They not only facilitate improved user interaction but also enhance data comprehension and retention. Real-world case studies affirm their effectiveness across industries, showcasing tangible benefits like increased audience participation.
Looking ahead, innovations in technology and interactivity signal a promising future. Smarter Digital Marketing is well-positioned to capitalise on these trends, enhancing interactive infographics’ engagement further. Engage your audience effectively by integrating these strategies into your digital content.
FAQ
What are interactive infographics?
Interactive infographics are visual tools transforming passive viewers into active participants. They enhance user engagement by allowing direct interaction with data, fostering deeper understanding and retention of information.
How do interactive infographics enhance user interaction?
Interactive infographics enhance user interaction by enabling engagement through clickable elements. This interactivity facilitates a more engaging user experience, making content exploration intuitive and dynamic.
What impact do interactive infographics have on information retention?
Interactive infographics improve information retention by encouraging active participation and engagement. Users who interact with content are more likely to remember and comprehend the information presented.
What are the key design elements in interactive infographics?
Effective interactive infographics rely on compelling graphic design and a user-centric approach. Prioritising intuitive design and impactful visuals ensures user engagement and accessibility.
Which tools and technologies are used for creating interactive infographics?
- Adobe Illustrator: Vital for creating vector graphics.
- Canva: Useful for designing interactive elements easily.
- Tableau: Facilitates complex data visualisation.
- Visme: Offers diverse templates for interaction.
- Infogram: Specialises in data-driven infographic creation.
How do interactive infographics boost audience engagement?
Interactive infographics significantly improve user interaction through data visualisation. They lead to increased audience retention and enhance engagement metrics more effectively than static infographics.
What are the major benefits of using interactive infographics?
- Increased information retention.
- Enhanced user engagement.
- Improved data exploration.
- Better audience comprehension.
How do interactive infographics compare to static infographics?
Interactive infographics offer a more dynamic and engaging experience than static infographics. Their interactive nature enables users to explore content deeply, boosting comprehension and retention.
Why are case studies on interactive infographics important?
Case studies illustrate successful applications of interactive infographics across industries. They demonstrate increased audience participation and the tangible benefits of enhanced engagement.
What are current trends in interactive infographics?
Current trends focus on improved interactivity and technology integration. Advances in digital design innovations shape the future of engagement strategies, creating more immersive user experiences.
What innovations are enhancing interactivity in infographics?
Innovations include advanced user interfaces and technology integrations like AR and VR. These enhancements provide diverse avenues for users to interact with infographics effectively.
What are future predictions for user engagement strategies?
- Expansion of personalised content.
- Growth in mobile-responsive infographics.
- Integration of AI-driven analytics.
- Increased use of storytelling elements.
- Broadened use of immersive technologies.
How does Smarter Digital Marketing leverage infographic trends?
Smarter Digital Marketing leverages these trends to elevate user engagement. By utilising innovative designs and technology, they create compelling infographic experiences to captivate audiences efficiently.
For professional support with this, see our PPC management.
For professional support with this, see our digital marketing services.
For professional support with this, see our web design services.
For professional support with this, see our about Smarter Digital Marketing.
For professional support with this, see our local SEO across Scotland and the UK.
